GIS Services
Geographic Information Services (GIS)
The County of Huron’s Business Technology Solutions team offers Geographic Information Systems (GIS) services in a variety of ways:
- You can explore geographical information using our online interactive viewers.
- You can download a pre-made map from our map library.
- You can access our open data site to download data for your own applications.
Interactive Mapping
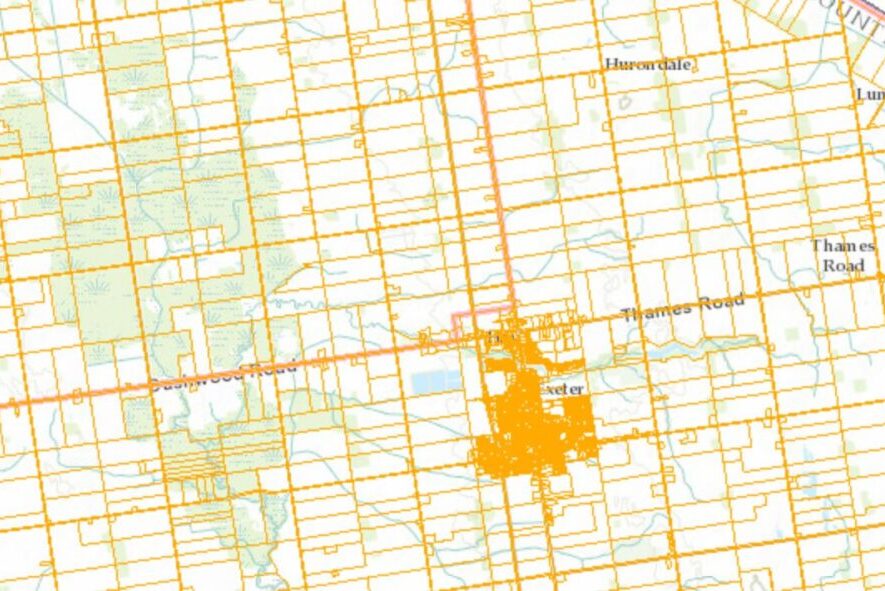
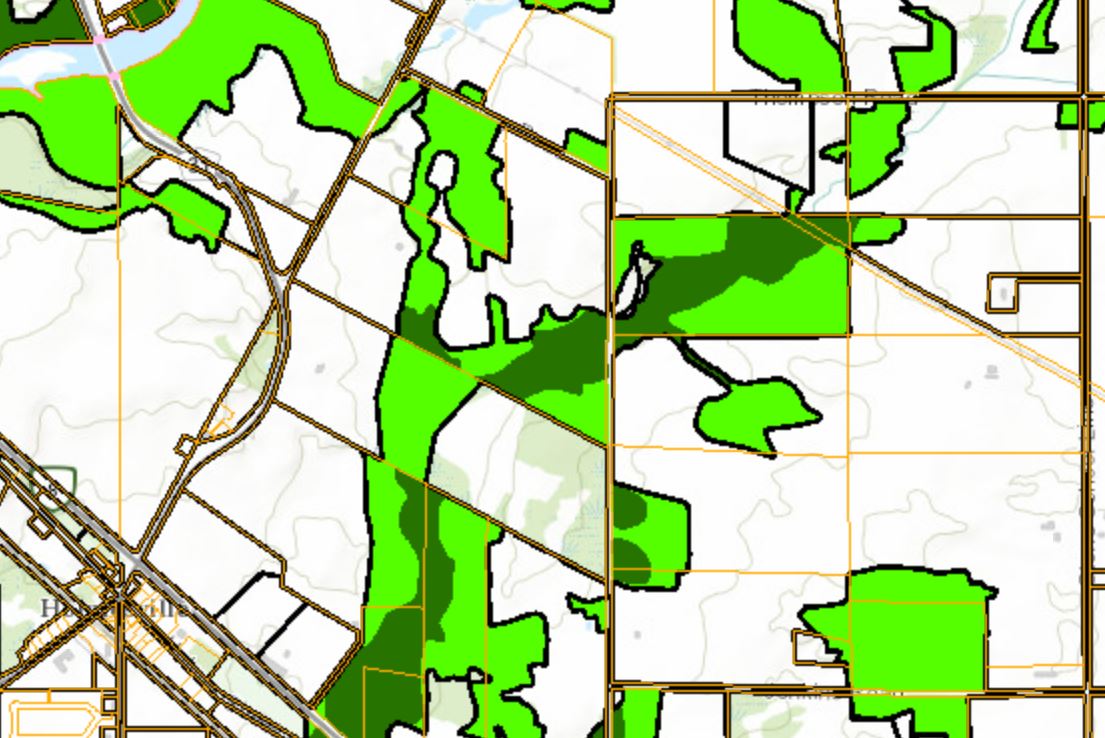
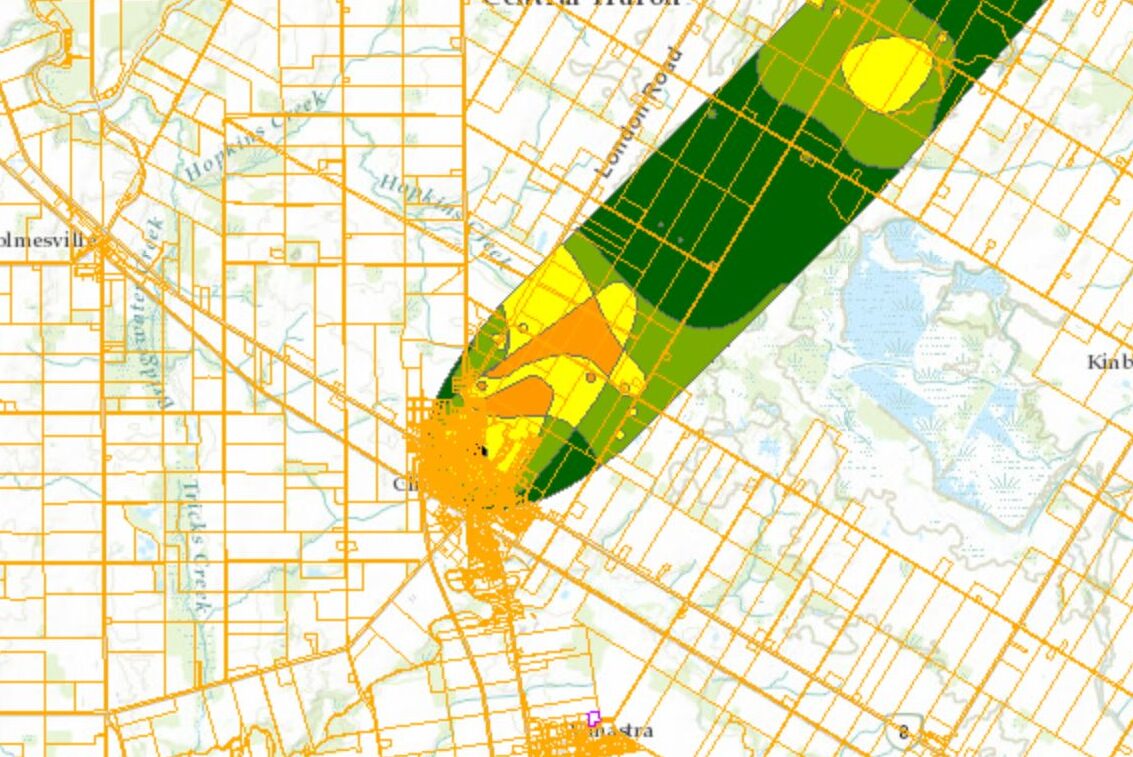
Explore one or many of our interactive maps. You can search by address, property roll number, road name, or points of interest. View various aerial imagery spanning from 1954 to 2020. Access to any of the sites is available anywhere, anytime. For help with the interactive site or more information, feel free to contact us or review our FAQ under Resources.
The online interactive mapping viewers use HTML5 and are designed to run in any browser, including mobile browsers. The following list describes the minimum requirements to load the map viewer:
- Browser supports JavaScript
- Google Chrome (current version recommended)
- Mozilla Firefox (current version recommended)
- Microsoft Edge (current version preferred)
- Microsoft Internet Explorer 9.0+ (11.0 preferred)
Map Library
Please feel free to interact with our featured applications, download and view maps from our map gallery, and/or order prints in various sizes.
Disclaimer: These maps are for illustrative and information purposes only. Do not rely on them as being a precise indicator of routes, locations of features, nor as a guide to navigation. They do not replace surveys and engineering drawings.
Featured Applications
GIS Application: Mapping Portal
Webpage: Open Data
Web Map Application: Salt Heritage
Web Map Application: Historic Topographic Maps
Map Gallery
Any of the maps below are available for free by downloading them. Optionally, printed copies are available as well. If what you are looking for is not available, feel free to navigate to our WebGIS (shown above) or download some Open Data (shown below) and make a custom map.
*Adobe Acrobat Reader is required to download and view these maps
County Maps
| Type of Map | Sizes | |||
| 8.5″x11″ | 24″x36″ | 36″x48″ | 44″x62″ | |
| 24″x36″ | 36″x48″ | 44″x62″ | ||
| 8.5″x11″ | 24″x36″ | 36″x48″ | 44″x62″ | |
| 8.5″x11″ | 24″x36″ | 36″x48″ | 44″x62″ | |
| 8.5″x11″ | 24″x36″ | 36″x48″ | 44″x62″ | |
| 24″x36“ | 36″x48″ | 44″x62″ | ||
| 24″x36″ | 36″x48″ | 44″x62″ | ||
| 8.5″x11″ | 24″x36″ | 36″x48″ | 44″x62″ | |
| 8.5″x11″ | 24″x36″ | 36″x48″ | 44″x62″ | |
| 8.5″x11″ | 24″x36″ | 36″x48″ | 44″x62″ | |
| 36″x48″ |
Municipal Maps
| Township | Roads | Location | ||
| 8.5″x11″ | 11″x17″ | 24×36″ | 8.5″x11″ | |
| 8.5″x11″ | 11″x17″ | 24×36″ | 8.5″x11″ | |
| 8.5″x11″ | 11″x17″ | 24×36″ | 8.5″x11″ | |
| 8.5″x11″ | 11″x17″ | 24×36″ | 8.5″x11″ | |
| 8.5″x11″ | 11″x17″ | 24×36″ | 8.5″x11″ | |
| 8.5″x11″ | 11″x17″ | 24×36″ | 8.5″x11″ | |
| 8.5″x11″ | 11″x17″ | 24×36″ | 8.5″x11″ | |
| 8.5″x11″ | 11″x17″ | 24×36″ | 8.5″x11″ | |
| 8.5″x11″ | 11″x17″ | 24×36″ | 8.5″x11″ |
Open Data
“Open Data” is defined as structured data that is machine-readable, freely shared, used and built on without restrictions. The County of Huron has established an Open Data Portal that contains a repository of datasets that have been made available to the public.
Data Requests
Data is now available through our Open Data Portal. If your data needs are more specific you may contact us for additional information.
Consultants working under contract for the County or area municipalities within Huron County may request GIS data needed for their work.
Notwithstanding the terms of the contract, at this time requests for GIS data must be made in writing (printed letter, e-mail, or fax). The request must identify the project for which the information is required; identify the municipality’s project manager and list, in detail, all of the information required. If the request is limited to a specific area, a shape file or map supporting the request is helpful.
The request must be submitted to the GIS team for processing. A data-sharing agreement might have to be signed as a result.
The GIS data is provided under the following terms and conditions:
Limited Licence Grant
Huron County grants to the “Licensee” a non-exclusive, non-transferable limited licence to use the GIS data without fee. Licensee may make copies and distribute complete, unmodified copies of the GIS data within the Licensee’s organization only.
Restrictions
The GIS data is copyrighted information of Huron County. The GIS data may not be sold, leased or assigned in whole or in part. The GIS data cannot be used in commercial products without the express permission of Huron County and it must not be used or posted on an external website.
Disclaimer
The GIS data is provided “as is” without warranty of any kind, either expressed or implied, including but not limited to the implied warranties of merchantability and fitness for a particular purpose. Huron County assumes no liability for any alleged or actual, incidental or consequential damages resulting from the furnishing, performance or use of this GIS data.
Municipal Addressing
Huron County GIS facilitates the management and maintenance of our established municipal addressing system.
A municipal address in Huron County consists of the municipality name, road name, and an address number. The assigned number represents the approximate distance from the baselines and bearing from our municipal baselines (Highway No. 4 and Highway No. 8). The address ranges for each rural block appear on the road sign at each intersection. Address numbers for each property in the County with a structure are clearly visible.
Partner municipalities within the boundaries of Huron County can use the provided “Municipal Addressing” form below to request the assignment of a new or modified urban or rural municipal address. Partner municipalities can also use the provided “Blade Order” form to request an intersection or property blade sign. Please contact 911@huroncounty.ca for more information.
The forms below are for municipal use only.
Resources
Print Order
Pre-order your prints by filling in the form below. A representative will be in touch within 1-2 business days to complete the order and summarize charges where applicable.
Before ordering, review the following list of prices. Prices are per printed copy and do not include 13% HST.
For any other print sizes, custom maps or questions, please contact us at gis@huroncounty.ca.
Frequently Asked Questions (FAQ)
How do I find my property?
There are a few ways to find your property. The following are three options:
- Option #1: Click on the “I want to…” menu and select either “Search by Address”, “Search by Roll Number”, or “Search by Lot & Concession”.
- Option #2: Click on the toolbar icon on the far right of the map viewer. Click on the tab “Search and Tasks” and select either “Search by Address”, “Search by ARN”, or “Search parcel by Lot & Con”.
How do I make layers visible? How do I turn them on and off?
- Click on the tab “Layers”, located on the lower-left panel (beside the “Home” tab)
- Click the desired layer check-box to activate (turn ‘on’) the layer
- If a layer has sub-layers, click on the + symbol beside the layer to expand it. Then, click the check-box beside the sub-layer of choice.
- Repeat these steps to deactivate (turn ‘off’) the layer
The following short video will visually show you what the layer list looks like, how to expand a layer, and how to turn the layer on and off.
How do I draw or add text to the map?
You can add many custom shapes to the map, including text. Some of the shapes are known as ‘Points’, ‘Lines’, and ‘Polygons’ but there are many others to choose from.
- Expand the toolbar by clicking on the toolbar icon, located at the top-right corner of the map
- Select the “Draw and Measure” tab in the toolbar
- Click on the drop-down arrow beside the “Point” tool for all shape and text options
- Select a shape or text
- Follow the on-screen instructions at the bottom of the map to draw the shape on the map
The following short video will show you how draw a shape on the map:
How do I change the shape that I’ve already drawn?
Once you’ve added shapes or text to a map, you can edit or delete them. If you do not have any custom shapes or text on the map, then the “Edit”, “Erase”, and “Clear” tools will not be available.
- Expand the toolbar by clicking on the toolbar icon, located at the top-right corner of the map
- Select the “Draw and Measure” tab in the toolbar
- Click on the drop-down arrow beside the “Edit” tool for your options
- To edit a shape, select “Edit”. Click or tap on the shape you want to change. Follow the instructions at the bottom of the map.
- To erase a single shape, select “Erase” instead of “Edit”. Click or tap on the shape you want to erase. Follow the instructions on the bottom of the map
- To clear all shapes, select “Clear”. Click “OK” to permanently erase all drawn shapes or click “Cancel” to escape.
The following video shows you how to edit a shape:
How do I change the style of my drawing?
- Navigate to the “Draw and Measure” toolbar
- Activate the drawing (or measure) element – it will be highlighted once active
- Select the Styles option that appears
- A window will open that lets you customize the style of your drawing
- Depending on the drawing type (point, line, polygon) the options will change
The following video shows you how to change the style of your drawing:
How do I use the buffer tool?
- Select the buffer tool
- Enter your drawing type (point, line or polygon), the distance and the units to buffer by
- Select “OK”
- Click on the map to start drawing (or to place your point) and double click to stop drawing
The following video shows you how to use the buffer tool:
How do I export coordinates?
- Select Plot Coordinates in the Draw and Measure toolbar
- click on map to generate list of points or enter coordinate values in the fields provided
- Navigate to the results window (along the bottom of the page)
- Click the horizontal bars in the Coordinates tab to expand export options (csv, xlsx, etc)
The following video shows you how to export coordinates:
How do I customize labels?
- Select the arrow beside the layer you want to customize and from the menu click “Customize Labels”
- Click the checkbox to “Show Labels”
- Click the Customize button to open the customize window
- Use this menu to adjust label properties
The following video shows you how to customize labels:
Can I put the shapes I created back on the map if I’ve already cleared or erased them?
Once you have erased or cleared a single or all shapes, they are permanently deleted. You will have to redraw them.
How do I measure the area of my property?
- Open the toolbar by clicking on the tool icon, located at the top-right corner of the map
- Click on the “Draw and Measure” tab to open the toolset
- Click on the drop-down arrow beside the tool with the ruler and select the “Polygon” tool
- Follow the on-screen instructions from the bottom of the map
The following video shows you how to measure the area of a property:
I have created some shapes, how do I export them?
This tool is only activated when a shape or measurement have been drawn on the map. To learn how to draw a shape or measurement, refer to How do I draw or add text to a map? or How do I measure the area of my property?
- Under the Draw and Measure tab, click on the tool Export Drawings
- Click OK to download the drawing or measurement. Click Cancel to abort.
- A “.zip” file is created that contains a “.shp” file. Save the “.zip” file to a location of your choosing.
- To use the file, unzip the “.zip” file and import or add the “.shp” file in your own mapping software that supports “.shp” files (such as ESRI ArcMap or QGIS)
How do I turn on JavaScript in my browser?
The following link will take you to a page that provides instructions for turning on JavaScript in browser you are currently using:
How to add road labels over the aerial imagery?
- With Imagery turned on, in the later list navigate to Transportation and Trails > Road Centreline and MTO Links > Road Centreline. Making sure all are checked.
- Select the “>” beside Road Centreline and then “Customize Labels”
- Ensure “Show labels” is checked, select “Customize”
- Configure the label (field: Name, Font size, placement: center-along)
- Next in the “Road Centreline” Config select “Turn on/off layer visualizations
- Now that labels are on we want to turn off the road centreline so only the labels are present.
- Select the drop down under “Select a visualization for your layer” choose “Custom Layer Style”
- Under the “Color” option select the drop down and shift the bottom slider to 0 (fully transparent)
- Select Apply/Done and now the labels will appear above the Imagery
The following video shows you how to customize labels:
How do I apply a filter?
- Navigate to the “Search and Tasks” tab and select the “filter” tool
- Find the layer you wish to apply the filter tool under “Data Source”
- Enter the field to filter by and the arguments (e.g. Zone = R2, Shape.STArea < 10000)
- Select “Filter” at the bottom of the window
The following video shows you how to apply a filter to a layer:
How can I download this data for personal use?
Most of our data has been made public and available on our Open Data Portal. For any additional questions, please contact us at gis@huroncounty.ca
How can I add my own GPS/GIS data?
Users can upload their GIS data into the Mapping Portal, it will become temporarily available on the map.
- Supported File Types: .csv, .xlsx, .kml, .gpx, or a .zip containing a FileGDB or shapefiles
Navigate to the Draw and Measure tab, then select “Upload Data”. From there you can browse to your desired files and add them to your map. They will appear at the top of the Layer List. Once you have closed your browsing session the data will no longer be available so make sure to make and export your maps before exiting.
*Reminder: when uploading shapefiles (.shp) you need to include the supporting files in the .zip folder.
Contact Geographic Information Services (GIS)
County of Huron |Geographic Information Services
2nd Floor – 57 Napier Street
Goderich, ON
N0M 1G0
Phone: 519.524.8394 ext. 3
Toll Free: 1.888.524.8394
Fax: 519.524.5677
Hours:
Monday – Friday 8:30 a.m. – 4:30 p.m.